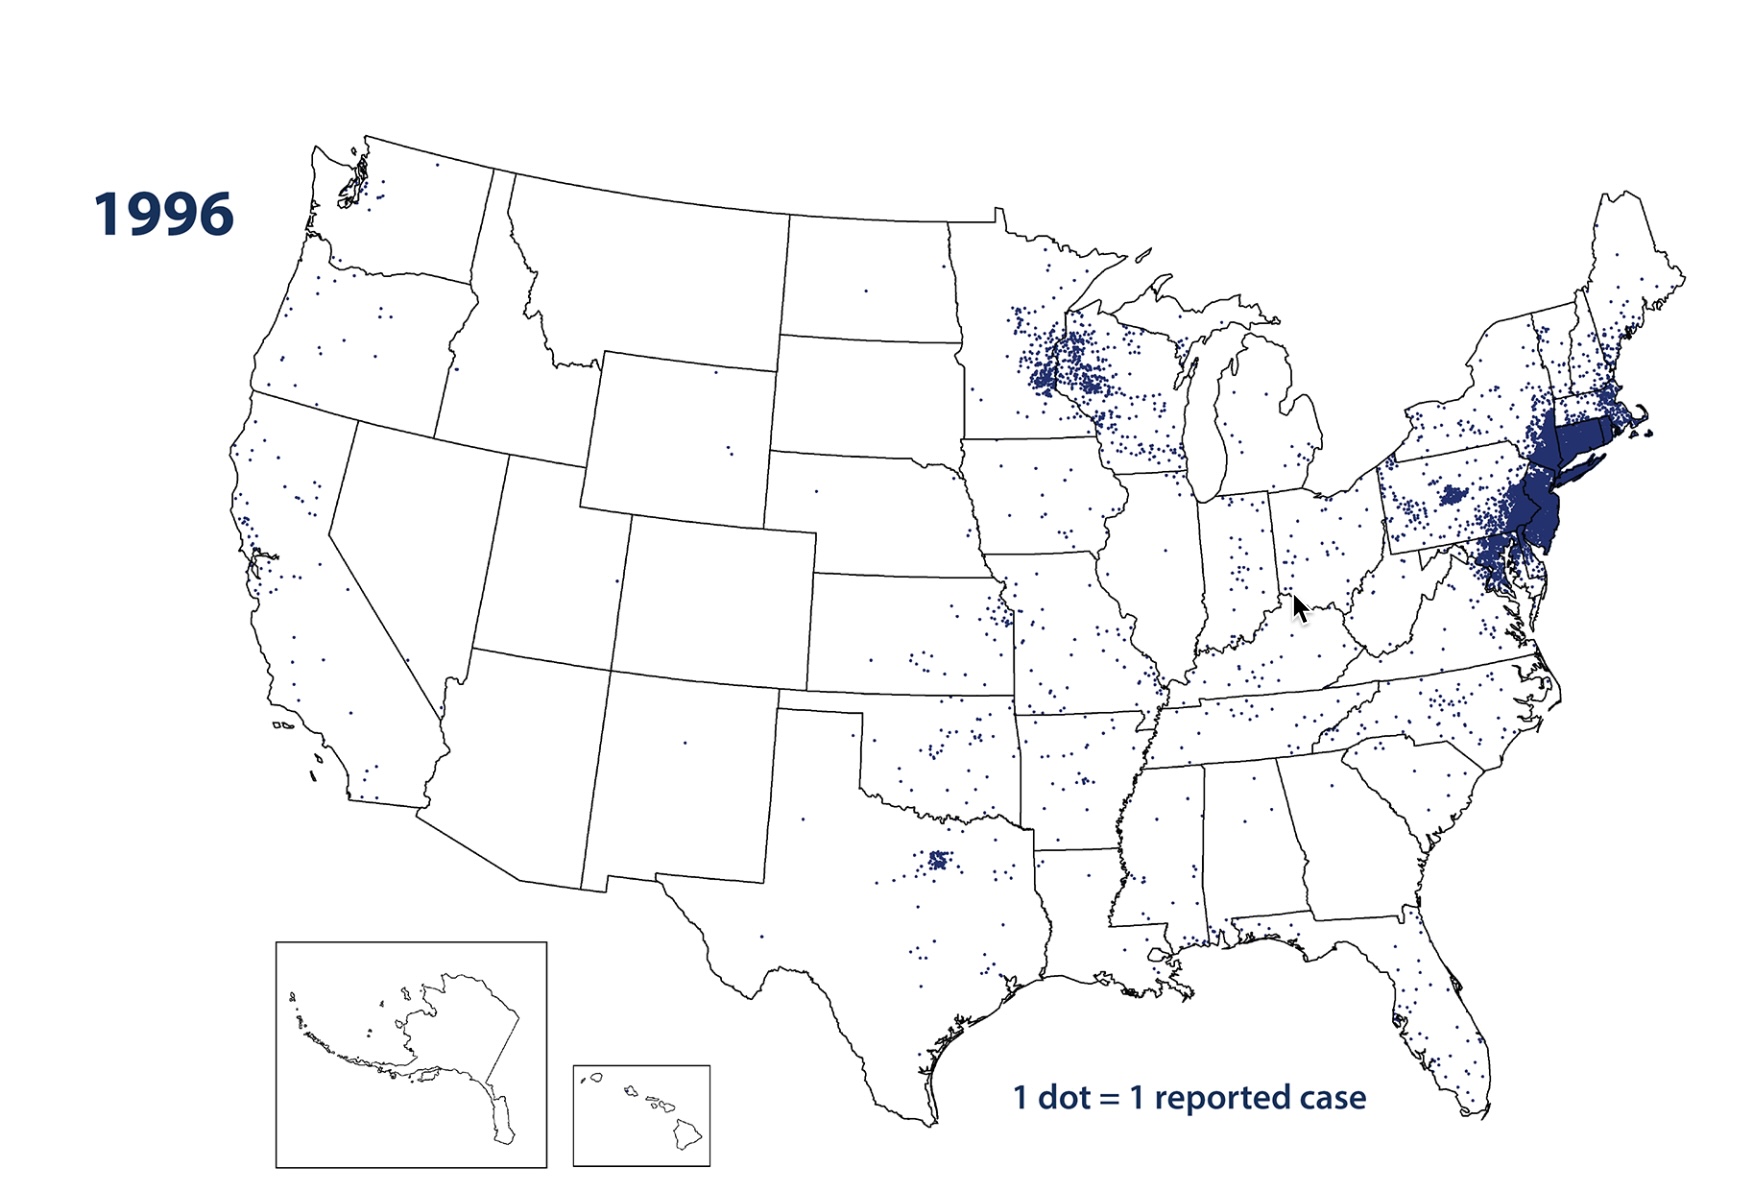
1996
2022
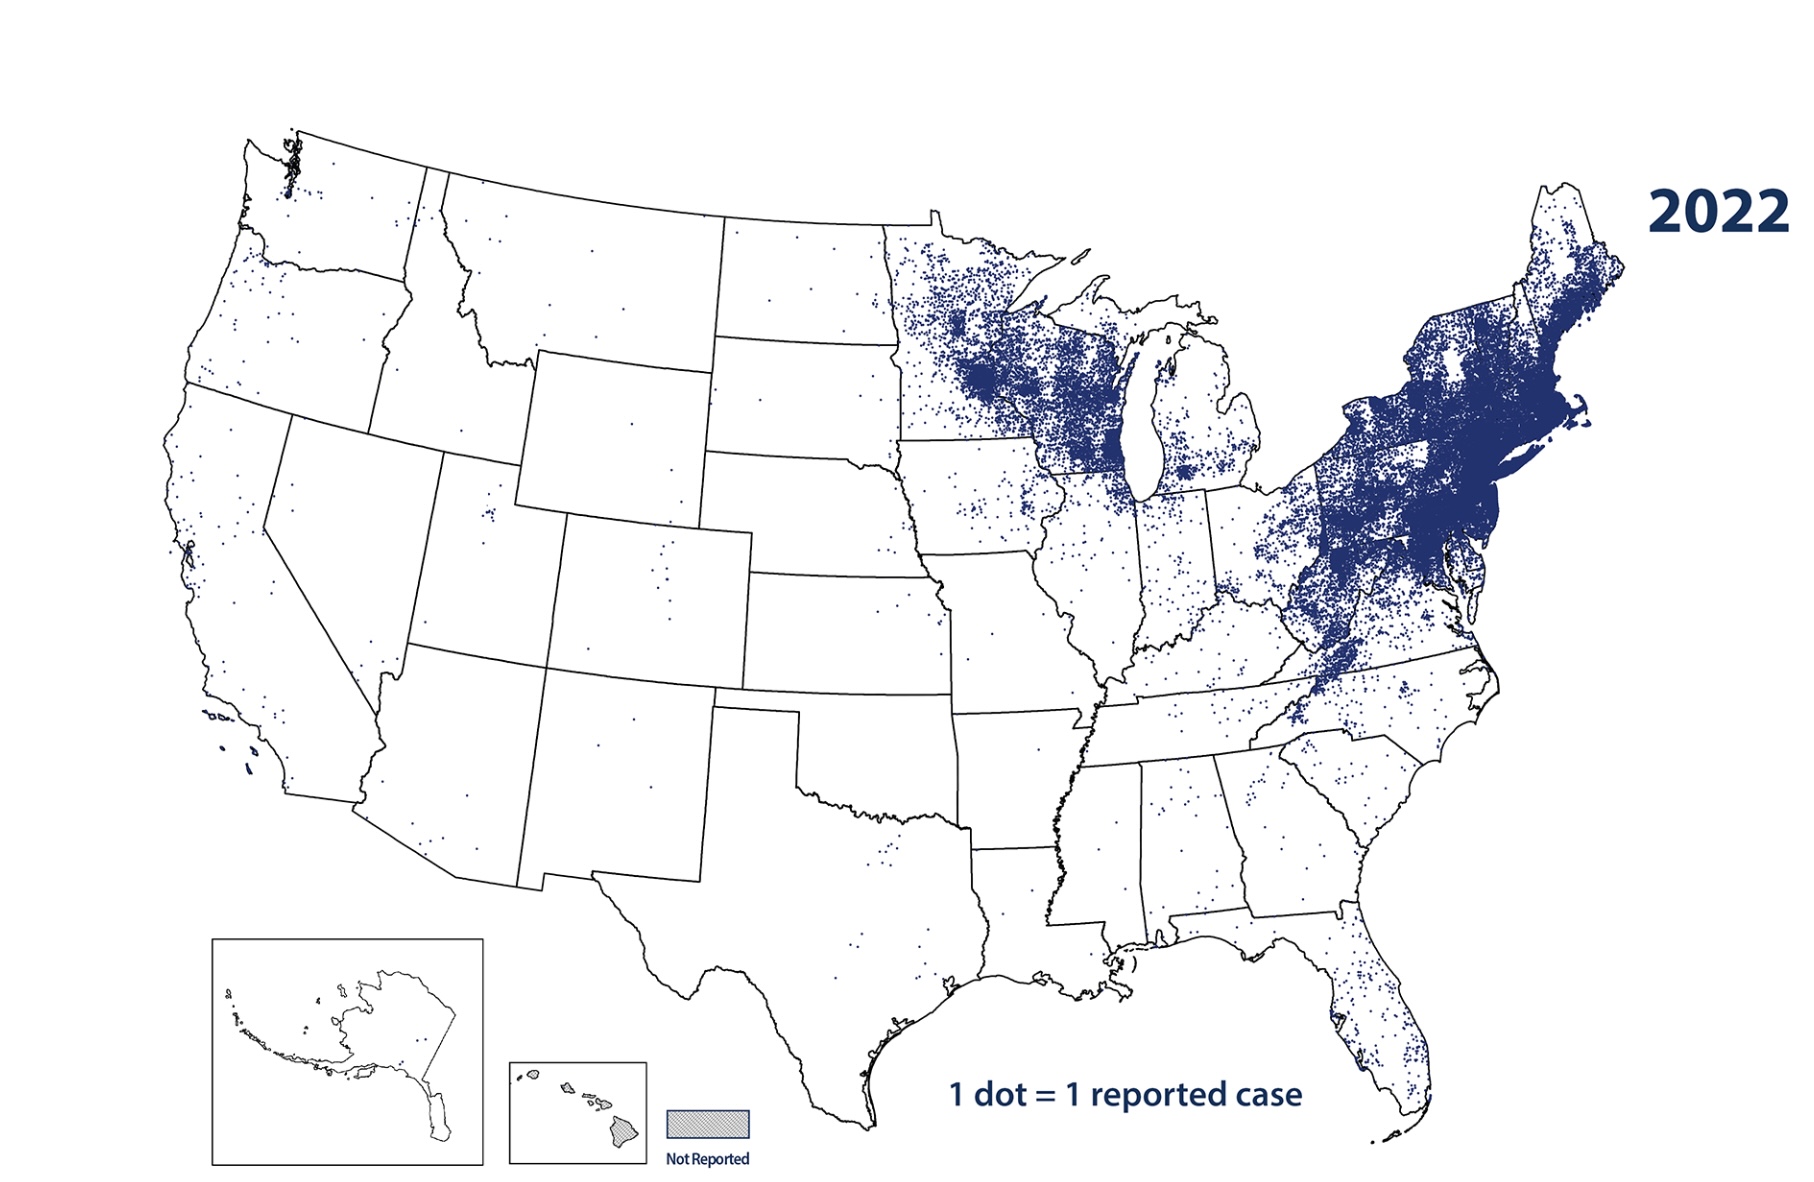
1 dot = 1 reported case
*These maps show the distribution of Lyme disease cases reported to CDC in 1996 and 2022. Each dot represents an individual case. Dots are placed randomly within each patient's county of residence, which might differ from the county where they were exposed. The year 1996 was chosen as the first year after a major case definition update that incorporated standardized testing approaches.