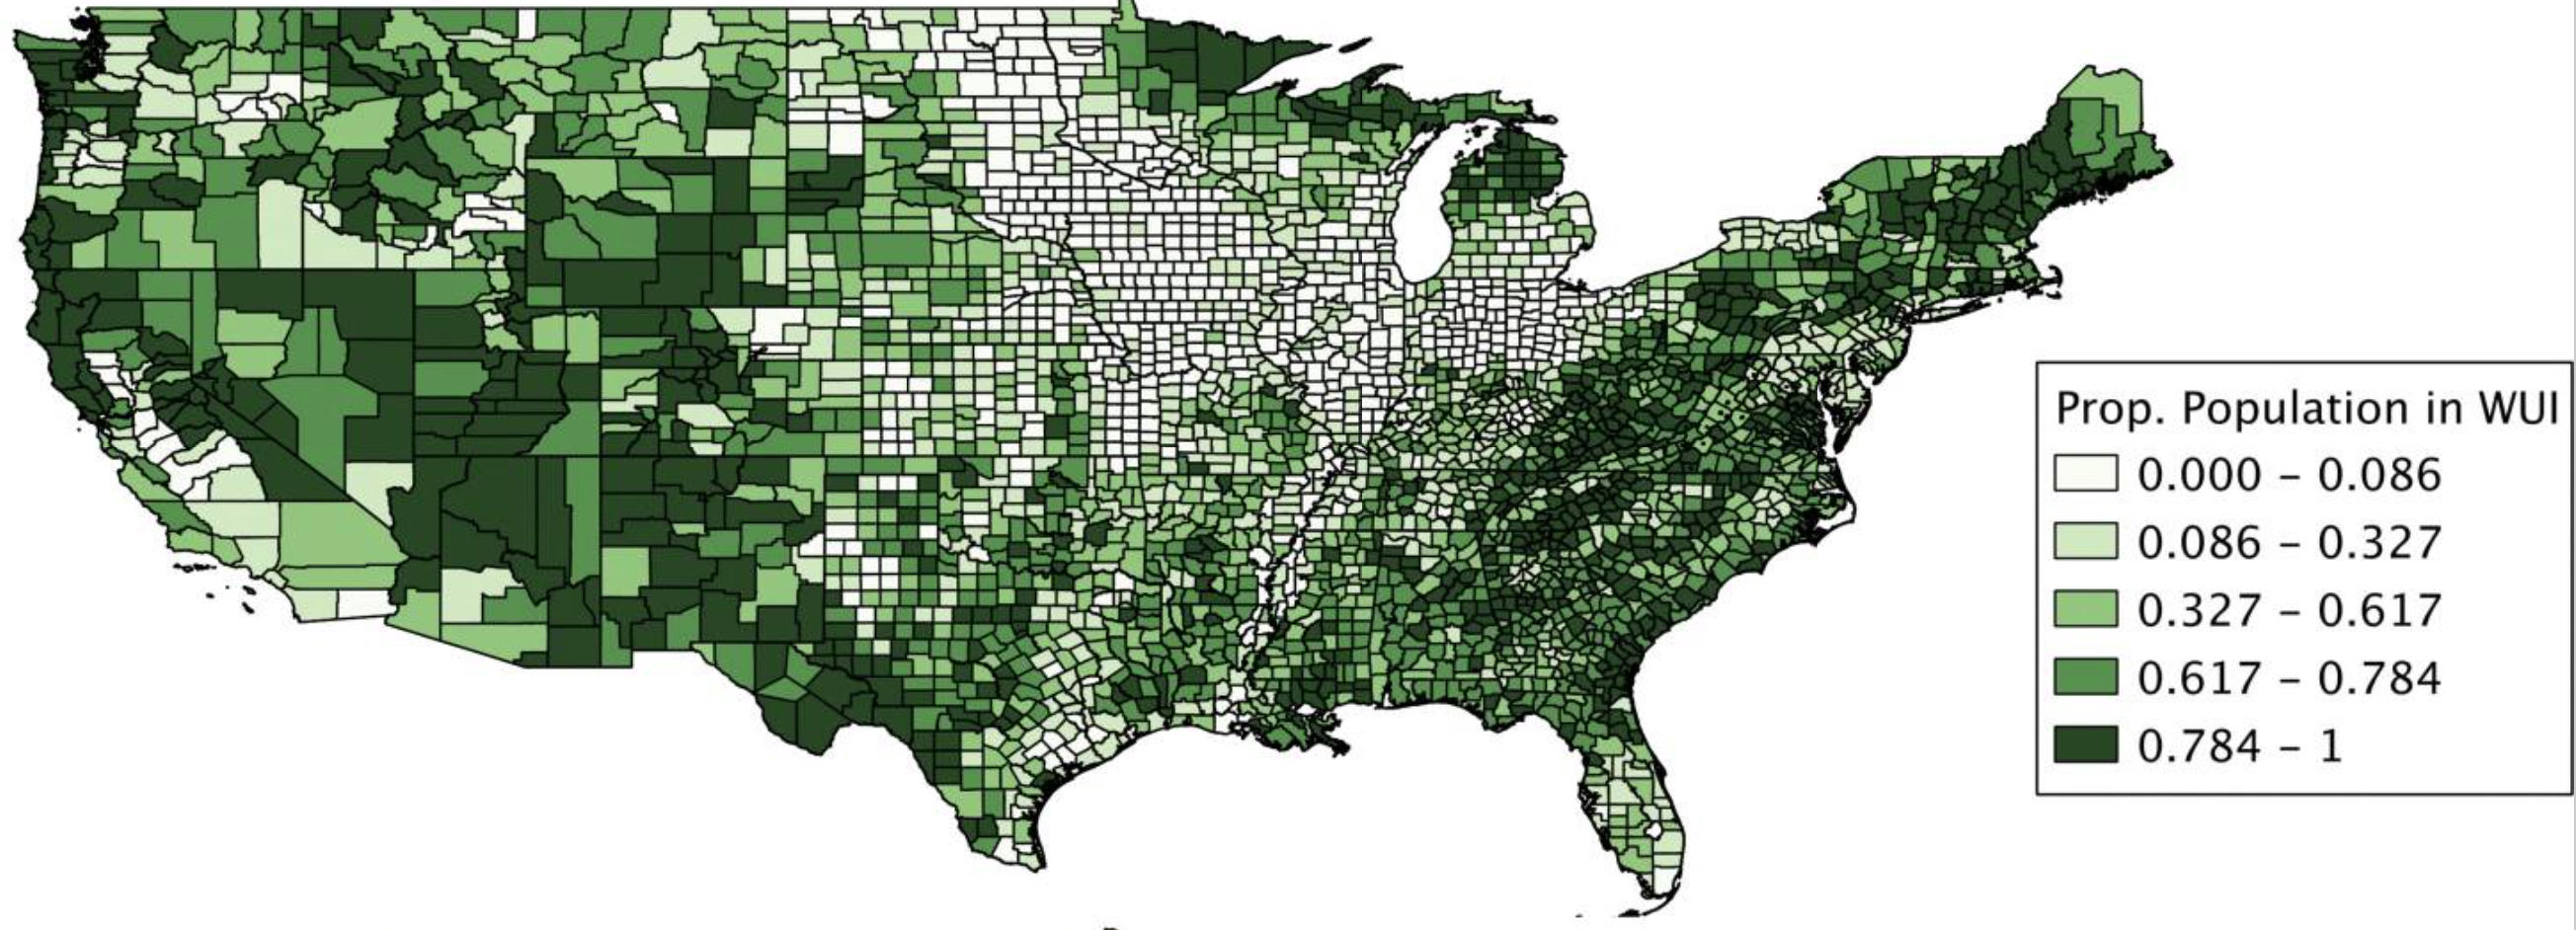
What Does This Map Show?
This visualization presents data on the proportion of population living in Wildland-Urban Interface (WUI) areas across counties in the United States. The WUI is where human development meets or intermingles with undeveloped wildland vegetation, creating areas of potential environmental conflict including wildfire risk, habitat fragmentation, and human-wildlife interactions.
Regional Analysis of WUI Population Proportion
| Region | Average WUI Population Proportion | Predominant Category | Notable Pattern |
|---|---|---|---|
| Northeast | 0.73 |
0.784 - 1.000
|
Highest concentration of WUI population; most counties in highest bracket |
| Southeast | 0.56 |
0.617 - 0.784
|
High concentrations across Appalachia and Atlantic coastal areas |
| Midwest | 0.18 |
0.000 - 0.086
|
Lowest WUI population proportions; concentrated in agricultural areas |
| Southwest | 0.41 |
0.327 - 0.617
|
Variable distribution with higher concentrations in mountainous regions |
| West | 0.52 |
0.617 - 0.784
|
High variation; coastal and mountain areas have highest proportions |
Regional WUI Population Distribution
Northeast
Average WUI Population Proportion
0.73
Counties in Highest Bracket
72%
Notable High WUI Counties:
- Essex County, MA (0.91)
- Fairfield County, CT (0.94)
- Rockingham County, NH (0.92)
Southeast
Average WUI Population Proportion
0.56
Counties in Highest Bracket
38%
Notable High WUI Counties:
- Albemarle County, VA (0.85)
- Cherokee County, NC (0.81)
- Beaufort County, SC (0.79)
Midwest
Average WUI Population Proportion
0.18
Counties in Lowest Bracket
65%
Counties with Higher WUI Proportion:
- Door County, WI (0.62)
- Cook County, MN (0.57)
- Vilas County, WI (0.71)
Southwest
Average WUI Population Proportion
0.41
Variation Across Region
High
Notable High WUI Counties:
- Santa Fe County, NM (0.76)
- Cochise County, AZ (0.68)
- Edwards County, TX (0.71)
West
Average WUI Population Proportion
0.52
Counties in Two Highest Brackets
47%
Notable High WUI Counties:
- Lake County, CA (0.88)
- Kitsap County, WA (0.85)
- Clackamas County, OR (0.82)
Key Observations
- The Northeast region has the highest proportion of population living in WUI areas, with most counties in the 0.784-1.000 range.
- The Midwest region shows the lowest WUI population proportions, with most counties below 0.086.
- Coastal and mountainous counties tend to have higher WUI population proportions across all regions.
- Appalachian counties show consistently high WUI population proportions, spanning multiple regions.
- Agricultural areas, particularly in the Great Plains, show the lowest WUI population proportions.
Note: Data represents the proportion of county population living in Wildland-Urban Interface areas. Values range from 0 (no population in WUI) to 1 (entire population in WUI).